File size / sequencing depth
The previous sections investigated the effects of different Java GC thread numbers (-XX:ParallelGCThreads) and various Java heap sizes (-Xmx) on the resource usage (CPU and memory) of several GATK tools. This served the identification of optimized Java GC settings and heap sizes. Optimized Java GC settings were then applied to OVarFlow.
This section now focuses on:
Resource usage over the complete run time of the single GATK tools with optimized Java GC and heap size settings.
The influence of sequencing depth and file size on the resource usage.
Therefore profiles of CPU and memory usage (RSS) were recorded for different input data. In doing so, this section also provides clues about the resources that are required by the single GATK tools and ultimately the entire workflow.
Again the previously utilized data sets were used to evaluate resource usage:
- SRR3041137
34 x average coverage after mapping, 18.7 Gb, 2 x 125 bp
- SRR3041413
16 x average coverage after mapping, 10.8 Gb, 2 x 150 bp
Those data sets were suitable to cover common different properties of the sequencing files, that could cause a peak load on CPU or memory. To account for statistical deviations in resource usage, every data set was evaluated twice (solid and dashed plots). Resource usage was monitored every three seconds using ps -p <pid> -o rss,%mem,%cpu. The shell script used for monitoring can be found within the repository of OVarFlow alongside the R script used to generate the final graphs.
bwa mem | samtools
The principle command use to evaluate the respective data set is given below:
1File=<SRR3041137|SRR3041413>
2bwa mem -M -t 6 \
3  -R "@RG\tID:id_${FILE}\tPL:illumina\tPU:dummy\tCN:SRR\tLB:lib_${FILE}\tSM:${FILE}" \
4  processed_reference/GCF_000002315.6_GRCg6a_genomic.fa.gz \
5  FASTQ_INPUT_DIR/${FILE}_R1.fastq.gz FASTQ_INPUT_DIR/${FILE}_R2.fastq.gz \
6  2> ${MON_DIR}/${FILE}_stderr_bwa.log | \
7samtools view -b /dev/fd/0 -o ${MON_DIR}/${FILE}.bam \
8  2> ${MON_DIR}/${FILE}_stdout_samtools.log
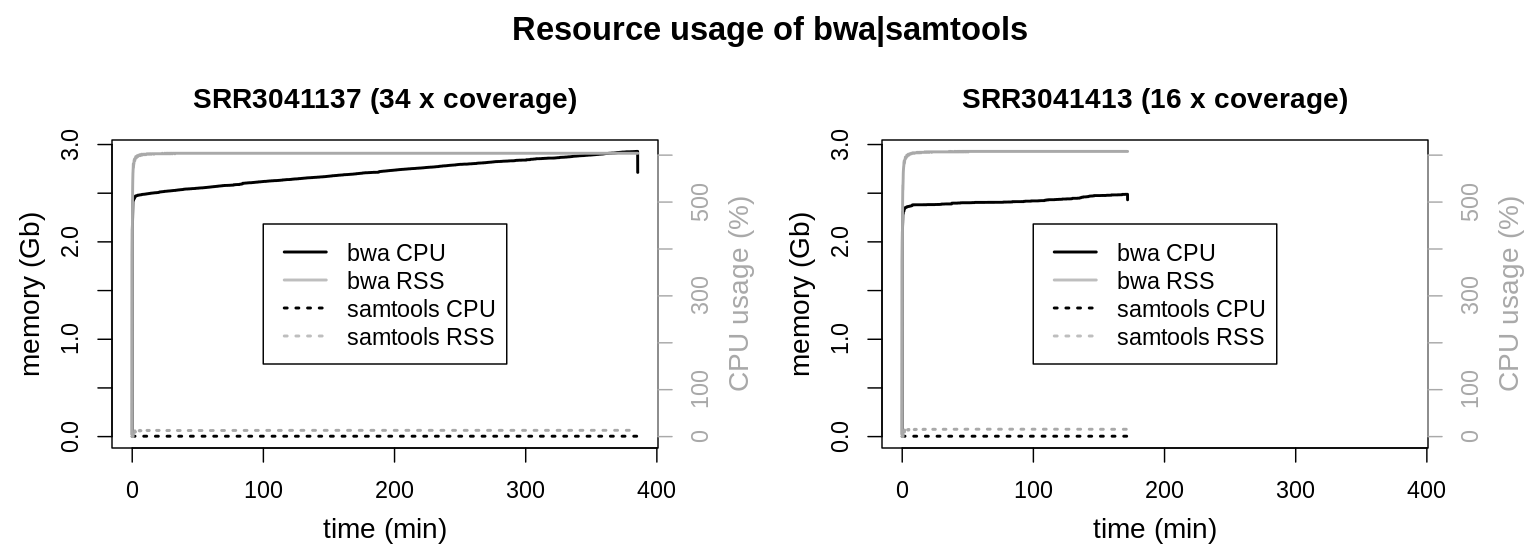
For the bwa mem | sortsam pipeline only one measurement is shown. Graphs of the second measurement were congruent and could not be distinguished from the first measurement. Resource usage of the two piped tools (bwa mem and samtools view) was recorded separately.
Resource usage of the compression from sam to bam format by samtools view can be neglected compared to bwa mem. As bwa mem was configured to use 6 threads, the CPU load is very consistent at 600 %. Interestingly memory usage of bwa mem is increasing linearly over the whole runtime of the process. RSS maxes out at 3 Gb for the larger data set and only reaches 2.5 Gb for the smaller one. To account for larger genomes and even higher coverage data sets, the maximum memory usage was set to 4 Gb within the Snakefile.
GATK SortSam
1GC=2; Xmx=10; File=<SRR3041137|SRR3041413>
2gatk --java-options "-Xmx${Xmx}G -XX:ParallelGCThreads=${GC}" SortSam \
3  -I 01_mapping/${FILE}.bam \
4  -SO coordinate \
5  -O ${MON_DIR}/${FILE}.bam \
6  --TMP_DIR ./GATK_tmp_dir/ 2> ${MON_DIR}/02_sort_gatk_${FILE}.log &
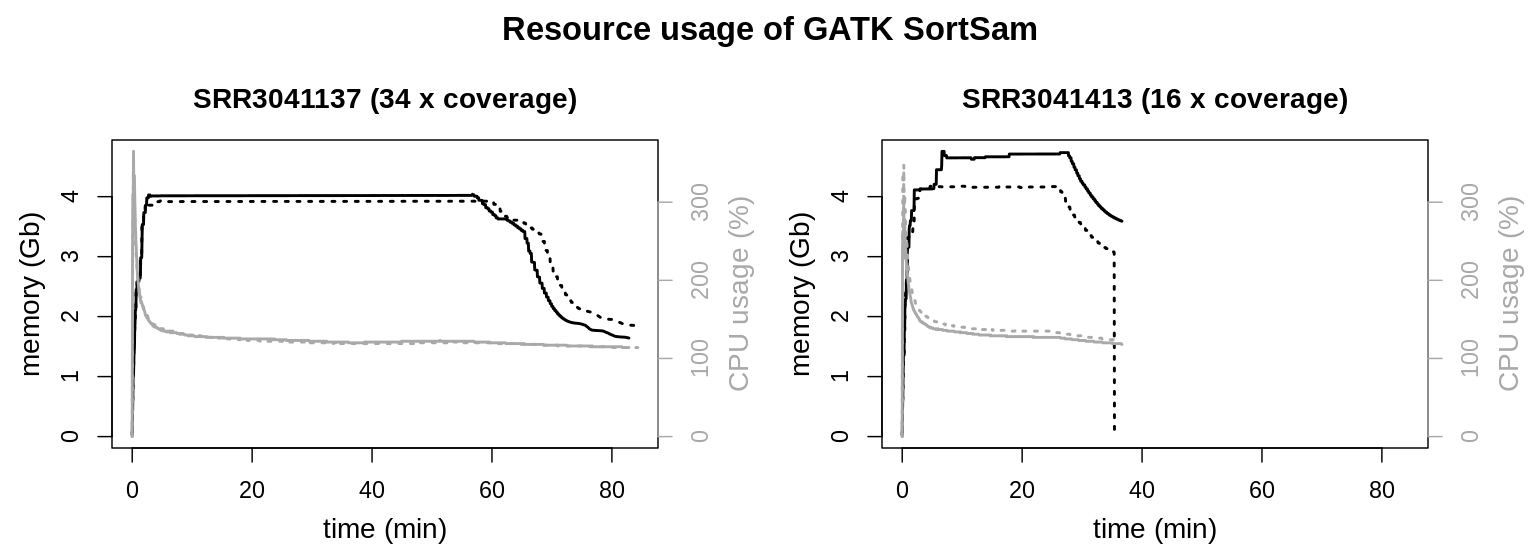
The dashed graph for SRR3041413 shows a steep decline, whereas the other graphs show a sudden end. This is an artifact of the measurement and not a systematic difference. Single measurements were recorded every three seconds. Most of the time the respective command just finished within this three second interval, allowing for no additional measurement. Sometimes a measurement was taken just while a process was freeing resource, recording this decline in resource usage.
Total CPU and memory usage are barely altered by sequencing depth or file size. Memory consumption reaches a plateau at approx. 4 Gb. There is a sharp peak at the beginning of the runtime for the CPU usage, dropping quickly to slightly above 100 % (meaning a little over a single thread is used). The clearest effect is on total runtimes. The larger file needs longer to process.
Aside from the -Xmx parameter, the amount of memory that is used by SortSam can be modified by setting the option --MAX_RECORDS_IN_RAM, which will inversely increase the number of file handles. The tool documentation of SortSam states:
When writing files that need to be sorted, this will specify the number of records stored in RAM before spilling to disk. Increasing this number reduces the number of file handles needed to sort the file, and increases the amount of RAM needed.
GATK MarkDuplicates
1GC=2; Xmx=2; File=<SRR3041137|SRR3041413>
2gatk --java-options "-Xmx${Xmx}G -XX:ParallelGCThreads=${GC}" MarkDuplicates \
3  -I 02_sort_gatk/${FILE}.bam \
4  -O ${MON_DIR}/03_mark_duplicates_${FILE}.bam \
5  -M ${MON_DIR}/03_mark_duplicates_${FILE}.txt \
6  -MAX_FILE_HANDLES 300 \
7  --TMP_DIR ./GATK_tmp_dir/ 2> ${MON_DIR}/03_mark_duplicates_${FILE}.log &
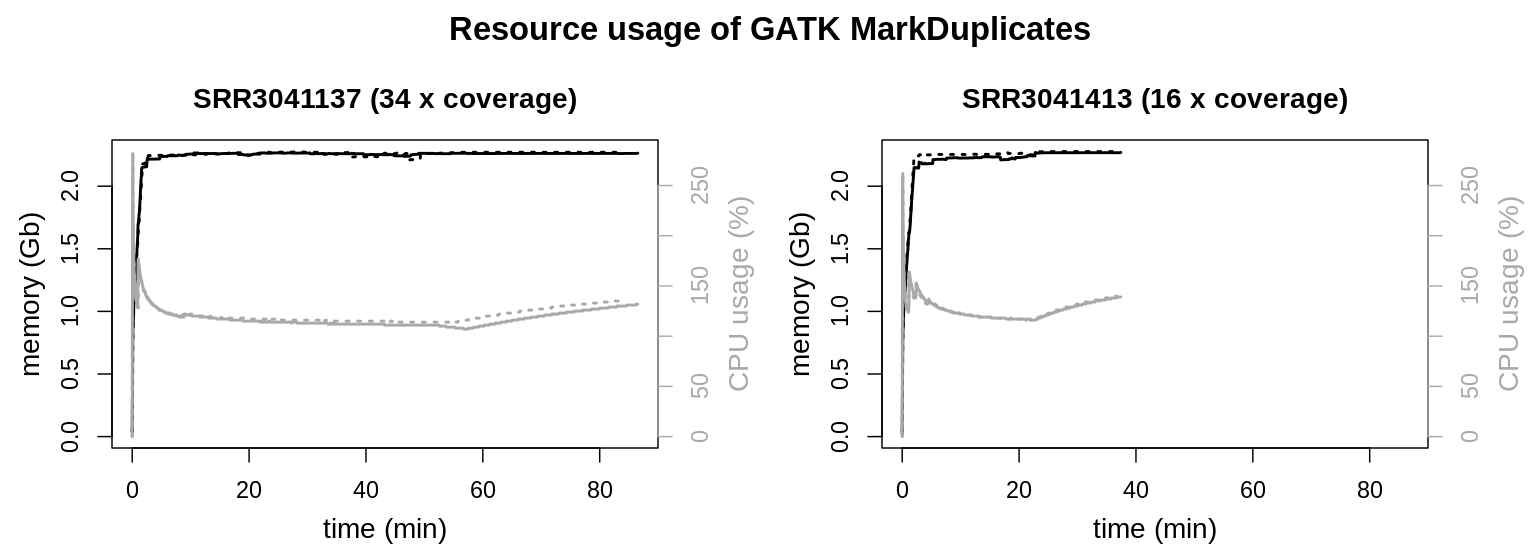
Both data sets show similar resource usage. Memory usage maxes out at a little over 2 Gb, where a plateau is reached. Also CPU usage is similar with a peak load at the beginning of the process and a continuous usage between 100 to 150 % during the rest of the runtime.
The tool documentation of MarkDuplicates mentions two parameters to modify memory usage, --MAX_RECORDS_IN_RAM and --SORTING_COLLECTION_SIZE_RATIO.
GATK HaplotypeCaller
1GC=2; Xmx=2; File=<SRR3041137|SRR3041413>
2gatk --java-options "-Xmx${Xmx}G -XX:ParallelGCThreads=${GC}" HaplotypeCaller \
3  -ERC GVCF \
4  -I 03_mark_duplicates/${FILE}.bam \
5  -R processed_reference/GCF_000002315.6_GRCg6a_genomic.fa.gz \
6  -O ${MON_DIR}/${FILE}.gvcf.gz \
7  -L "NC_006093.5"  2> ${MON_DIR}/${FILE}.log &
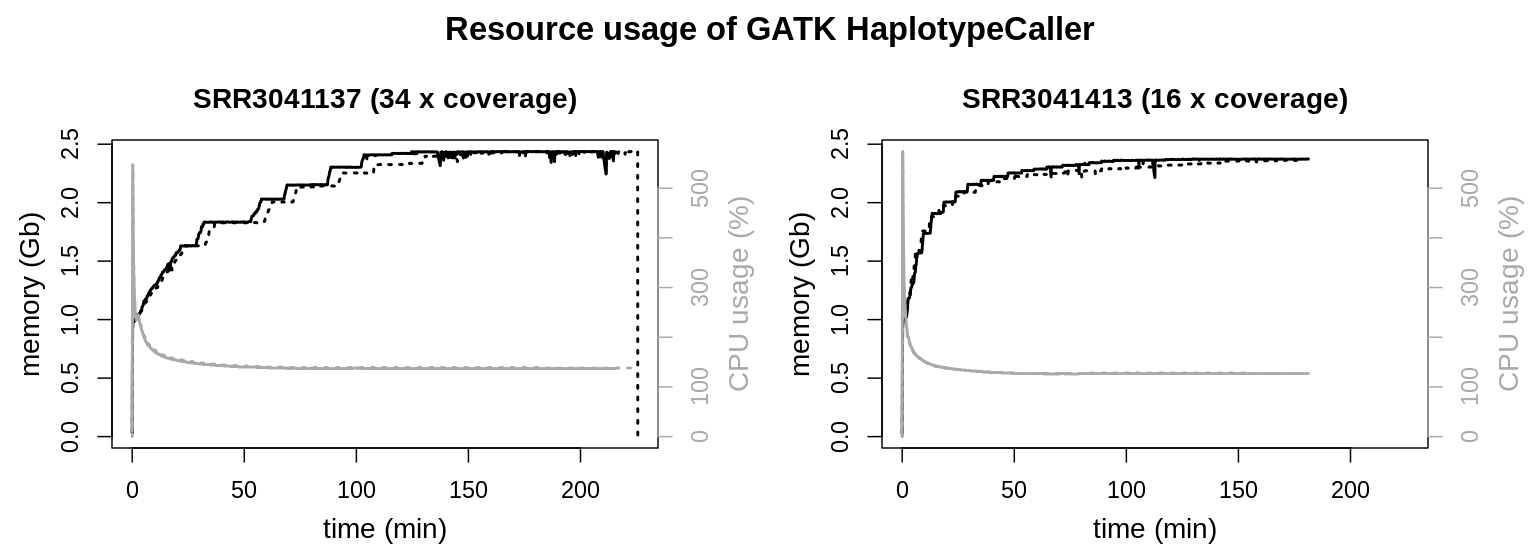
Again resource usage of HaplotypeCaller is very similar for different file sizes or sequencing depth, respectively. Both reach a plateau around 2.5 Gb memory usage. CPU loads have a very pronounced peak load quickly declining to approx. 135 % CPU load for the rest of the runtime.
HaplotypeCaller possesses the longest runtimes of the used GATK tools. In the above graphics a smaller contig (NC_006093.5; 36,374,701 bp) was evalutated to reduce runtime. To identify any particularities during longer runtimes, the application was also observed for a longer period. Therefore an interval comprising the two larges contigs (NC_006088.5, 197,608,386 bp & NC_006089.5, 149,682,049 bp; sample SRR3041137) was also evaluated.
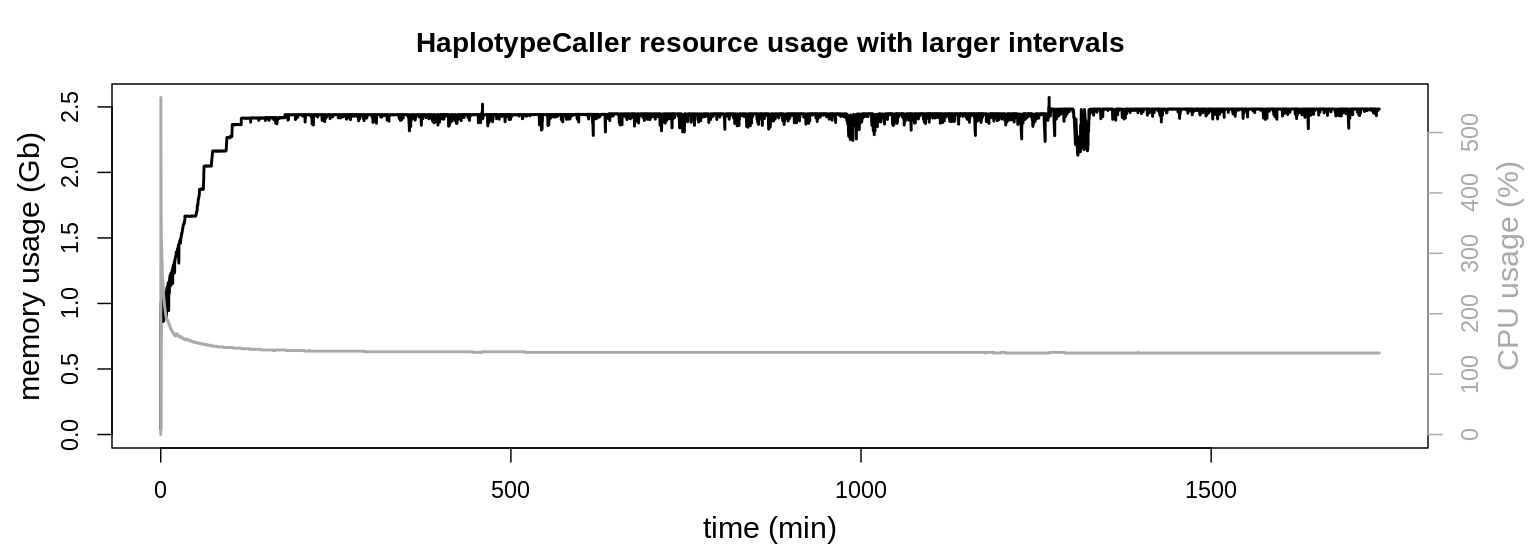
CPU usage stays at approx. 135 % during the majority of the runtime. Also resident set size keeps its plateau around 2.5 Gb of memory usage, only with minor fluctuations.
GATK CombineGVCFs
Combining the interval files was migrated to use GatherVcfs, which is considerably more efficient. This section is kept for reference purposes. Also CombineGVCFs is still used to consolidate all individuals into a single cohort. Due to its very brief runtime GatherVcfs was not accessed further.
1GC=2; Xmx=2; File=<SRR3041137|SRR3041413>
2gatk --java-options "-Xmx${Xmx}G -XX:ParallelGCThreads=${GC}" CombineGVCFs \
3  -O ${MON_DIR}/${FILE}.gvcf.gz \
4  -R processed_reference/GCF_000002315.6_GRCg6a_genomic.fa.gz \
5  -V 04_haplotypeCaller/${FILE}/interval_2.gvcf.gz \
6  -V 04_haplotypeCaller/${FILE}/interval_4.gvcf.gz \
7  -V 04_haplotypeCaller/${FILE}/interval_1.gvcf.gz \
8  -V 04_haplotypeCaller/${FILE}/interval_3.gvcf.gz 2> ${MON_DIR}/05_gathered_samples_${FILE}.log &
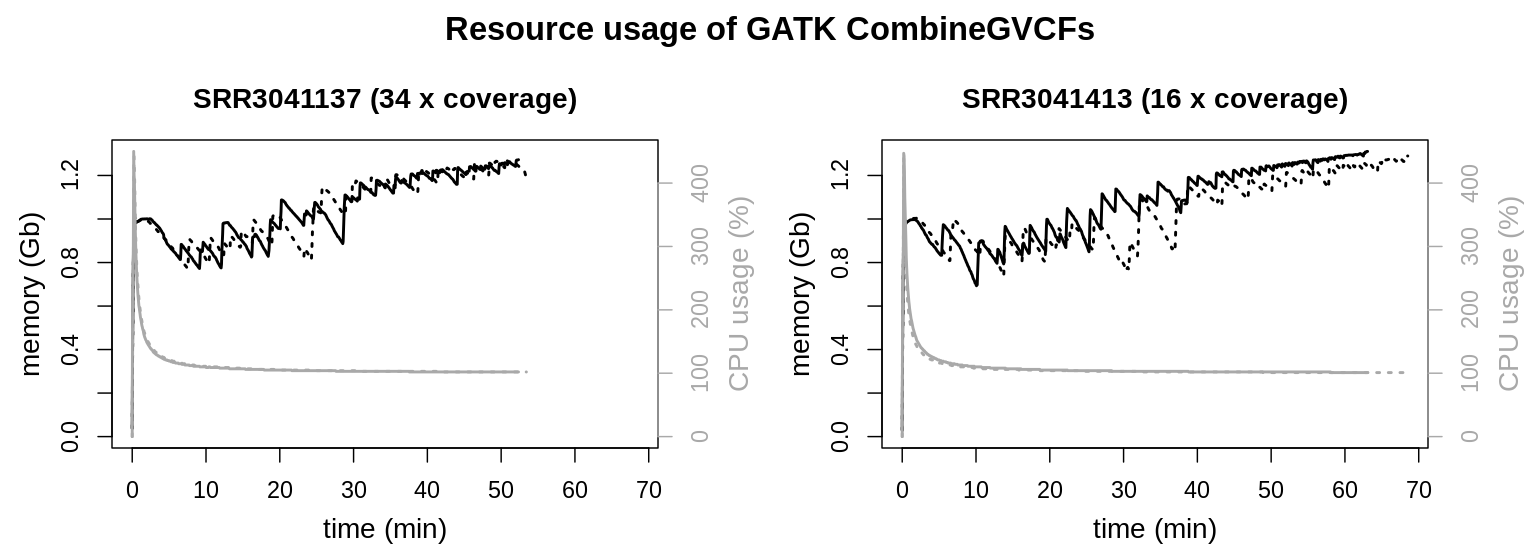
CPU and memory usage are similar for both files. Only runtimes are elongated for the larger data set. Interestingly file size and initial sequencing depth are not proportional for the input data (gvcf files). For the data set possessing the higher coverage HaplotypeCaller created a smaller gvcf file set (SRR3041137: 34 x coverage, 3.7 Gb) as for the data with the lower coverage (SRR3041413: 16 x coverage, 4.8 Gb). Runtime of the process is clearly influenced by the total file size of the input data and not the initial sequencing depth.
Conclusions
From the above measurements some conclusions can be drawn concerning:
- File size / sequencing depth
There is a clear correlation between file size and the runtime of the respective process. The larger the file the longer it takes to evaluate it. Within the workflow there is also a clear correlation between sequencing depth and file size up to data processing by HaplotypeCaller. Obviously higher sequencing depth means larger bam files. HaplotypeCaller on the other hand converts the input data (bam files) into a totally new format (gvcf files), where higher sequencing depth does not necessarily mean more detected variants. So generally runtimes are influenced by the file size of the input data, which is connected to the size of bam files but not necessarily to gvcf file size.
- Similarities and differences in resource usage of the tools
One striking similarity of all observed GATK tools is their peak CPU load at the beginning of each process, quickly dropping again in the first few minutes. Only the peak height, meaning absolute CPU usage, is different. The highest peaks were observed for HaplotypeCaller with approx. 600 % CPU load (meaning 6 parallel threads). On the lower end MarkDuplicates was only using up to 250 % CPU (2 1/2 threads). Over the remaining runtime no tools showed a CPU usage of more than 150 %.
Memory usage on the other hand tends to reach a plateau, which is not necessarily identical to the limits specified by the Java heap size.
- Maximum resource usage
Monitoring CPU and memory usage over the complete runtime of a process helps to identify bottlenecks and the most demanding tools in both areas. There are no major differences in CPU usage. Beside the peak load each observed GATK tool uses 100 - 150 % of the CPU (1 to 1 1/2 threads), with CombineGVCFs being very close to a single thread (approx. 103 %). This was considered in the Snakefile by specifying two threads for all of the above tools besides CombineGVCFs, which was kept at the default of one thread.
In any case maximum memory usage is more important, than maximum CPU usage. In case that CPU becomes a bottleneck runtimes of the total data evaluation will simply increase. This might be annoying as processes might get paused but won’t do further harm. Memory usage on the other side is a different issue. Memory usage cannot be postponed. On a system that runs out of memory the out of memory kill (OOM killer) will be invoked and select a task to kill to free up memory for the sake of the total system.
Therefore additional precautions were taken, to prevent OVarFlow from running out of memory. The maximum RSS values of the respective tool are decisive for planing of resource usage. Within the OVarFlows Snakefile the resources keyword is used to specify the maximum amount of memory that was observed within the above measurements. Thereby the amount of memory of the system OVarFlow is executed upon, can be specified if needed (keep in mind, the resources keyword will not enforce those limits). In this case a full command line would look like this:
snakemake -np --cores <threads> -s /path/to/Snakefile --resources mem_gb=<amount of system memory>
The following resource requirements were set for the respective tool (resources and threads keyword in the Snakefile), while always adjusting upwards to the next full gigabyte value:
Tool |
Java settings |
Snakemake keyword |
||
GC |
heap size |
resources ( |
threads |
|
bwa|samtools |
4 Gb |
6 |
||
SortSam |
2 |
10 Gb |
5 Gb |
2 |
MarkDuplicates |
2 |
2 Gb |
3 Gb |
2 |
HaplotypeCaller |
2 |
2 Gb |
3 Gb |
2 |
GatherVcfs |
2 |
2 Gb |
2 Gb |
1 |
CombineGVCFs |
2 |
2 Gb |
2 Gb |
1 |
The above thread values are not identical to the Java GC thread settings nor to the Java heap size. These values only reflect the approximate resource usage of the respective tool and are meant for resource management or planning by Snakemake, respectively.