Entire Workflow
Previously only single applications were benchmarked and optimized. Ultimately it’s the resource usage of the entire workflow, that’s of concern. Thus the entire OVarFlow workflow was monitored. Again CPU as well as memory usage were observed. This served several purposes:
Demonstrating the effect of the applied Java options on the entire workflow, thereby validating the effect.
Identification of excessive resource utilization during the workflow, that might still be left.
Giving an example of what can be done with a specific given hardware and how to maximize its utilization by adjusting some Snakemake options without introducing new overloads.
Again chicken (Gallus gallus) served as a reference organism, with the reference genome and annotation given in the benchmarking introduction. Six different runs from the study PRJEB12944 were used as sample data, with average coverages between 24 and 28 (ERR1303580, ERR1303581, ERR1303584, ERR1303585, ERR1303586, RR1303587).
Benchmarking was performed on a single cluster node (SGE), whose resources were exclusively reserved for OVarFlow. Exclusive reservation was achieved by requesting as many slots as the hardware provided parallel threads (in this case 40). The following hardware specifications where given:
memory (file: /proc/meminfo):
MemTotal:       264105108 kB (= 251.9 Gb)
SwapTotal:      124999676 kB (= 119.2 Gb)
CPU (command:
lscpu):Architecture: x86_64 CPU op-mode(s): 32-bit, 64-bit Byte Order: Little Endian CPU(s): 40 On-line CPU(s) list: 0-39 Thread(s) per core: 2 Core(s) per socket: 10 Socket(s): 2 NUMA node(s): 2 Vendor ID: GenuineIntel CPU family: 6 Model: 62 Model name: Intel(R) Xeon(R) CPU E5-2670 v2 @ 2.50GHz Stepping: 4 CPU MHz: 2042.538 CPU max MHz: 3300.0000 CPU min MHz: 1200.0000 BogoMIPS: 4989.96 Virtualization: VT-x L1d cache: 32K L1i cache: 32K L2 cache: 256K L3 cache: 25600K NUMA node0 CPU(s): 0-9,20-29 NUMA node1 CPU(s): 10-19,30-39 Flags: fpu vme de pse tsc msr pae mce cx8 apic sep mtrr pge mca cmov pat pse36 clflush dts acpi mmx fxsr sse sse2 ss ht tm pbe syscall nx pdpe1gb rdtscp lm constant_tsc arch_perfmon pebs bts rep_good nopl xtopology nonstop_tsc cpuid aperfmperf pni pclmulqdq dtes64 monitor ds_cpl vmx smx est tm2 ssse3 cx16 xtpr pdcm pcid dca sse4_1 sse4_2 x2apic popcnt tsc_deadline_timer aes xsave avx f16c rdrand lahf_lm cpuid_fault epb pti intel_ppin ssbd ibrs ibpb stibp tpr_shadow vnmi flexpriority ept vpid fsgsbase smep erms xsaveopt dtherm ida arat pln pts md_clear flush_l1d
Resource usage of the entire machine was recorded every 30 second throughout the workflow using two shell commands:
mpstat 30 > mpstat_statistics &
sar -r 30 > sar_statistics &
Processing of measurements was done using some shell commands including sed and awk to convert the file format into something more suitable for plotting CPU and memory usage with R. Again the respective scripts are deposited in the OVarFlow repository.
Workflow without optimization
To obtain a baseline measurement the entire workflow was executed without any Java optimizations. Therefore the settings for the number of parallel GC threads as well as the amount of memory available for the heap space where automatically chosen by the JVM. CPU utilization was already considered in the Snakefile through the threads keyword, as stated in the following table:
Tool |
Rule |
Threads |
bwa / samtools |
mapping |
6 |
SortSam |
sort_sam_gatk |
2 |
MarkDuplicates |
mark_duplicates |
2 |
HaplotypeCaller |
haplotypeCaller |
2 |
CombineGVCFs |
gather_intervals |
1 (default) |
default for other tools |
1 |
|
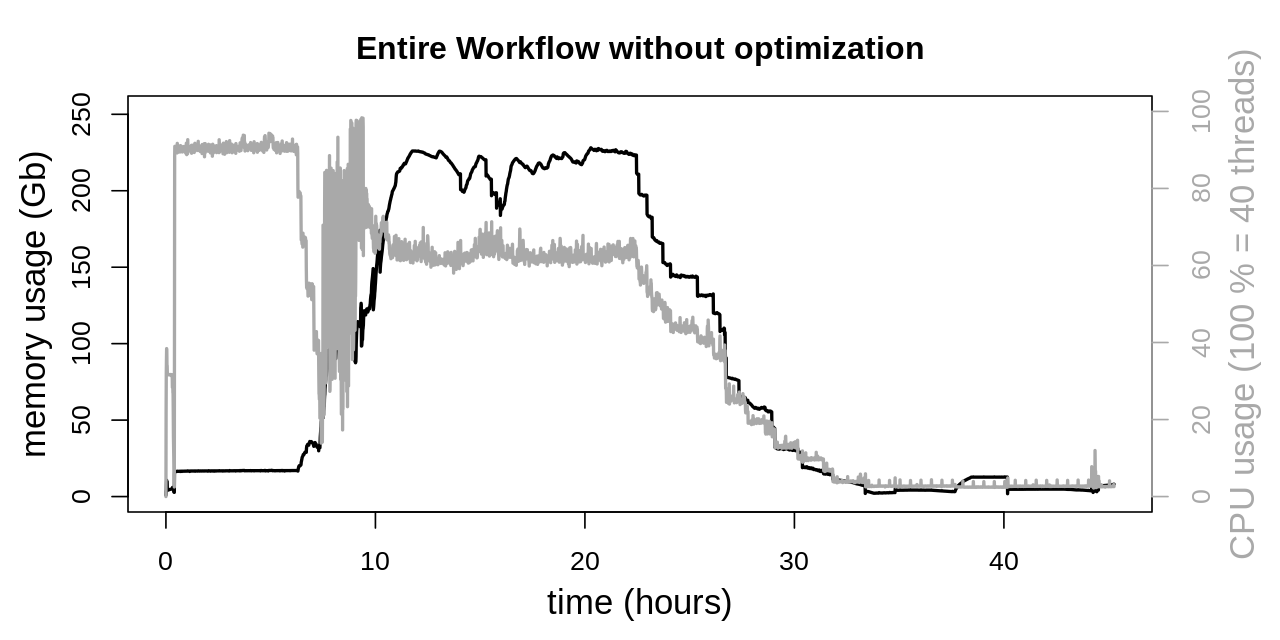
System resources, both CPU and memory, show a high degree of utilization. Overall there are three phases of the workflow, that can be distinguished. The first phase (approx. to 7 h) is about mapping of the reads. Here high CPU utilization is desirable, while memory usage is rather low. In the second phase various GATK applications (SortSam, MarkDuplicates, HaplotypeCaller and CombineGVCFs) are executed in parallel. Here CPU utilization shows considerably more variability while memory usage peaks at around 225 Gb. In the third phase (after approx. 33 h) all tasks that can be executed in parallel are finished, and both CPU and memory utilization is rather moderate.
Workflow with Java GC optimization
The Java VM was tweaked by limiting the number of GC threads to two (-XX:ParallelGCThreads=2) for SortSam, MarkDuplicates, HaplotypeCaller and CombineGVCFs. Other GATK tools were limit to four GC threads. Finally the Snakefile was invoked limiting parallel threads to 38 (snakemake -p --cores 38).
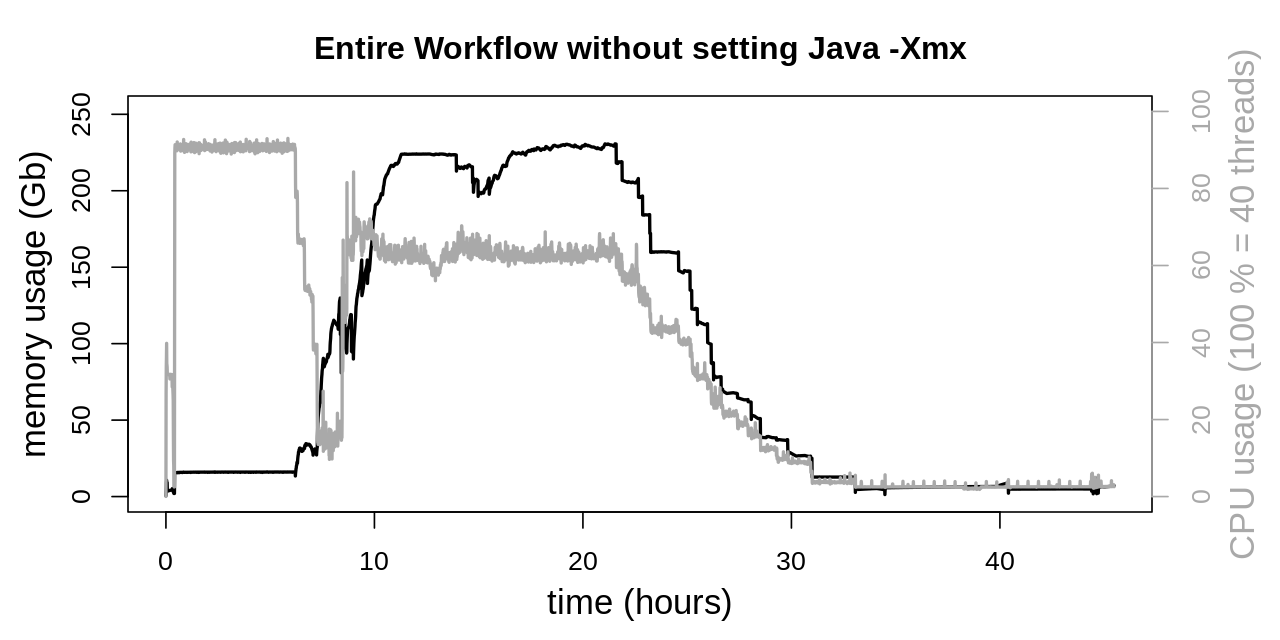
As expected memory usage is not altered by the Java GC modification. The effect on CPU usage is very noticeable, being more consistent at the beginning of the second phase. Also CPU usage doesn’t peak as high as previously. This is related to the execution of SortSam and MarkDuplicates. CPU utilization of both applications was considerably affected by the GC thread count (see Java Garbage Collection section). HaplotypeCaller and CombineGVCFs were considerably less affected by Java GC, as is reflected by the barely altered plateau at approx. 60 - 70 % CPU utilization. This moderate degree of CPU utilization is due to the fact, that Snakemake only allows for the specification of integer thread numbers, while HaplotypeCaller uses approx. 130 % of the CPU. 70 % of the second CPU core remains unused when specifying 2 threads for the HaplotypeCaller.
Workflow with Java heap optimization
The second regulating screw to the JVM is heap size (-Xmx) with some considerable effects on memory consumption. Two different settings were evaluated.
Workflow with Java -Xmx10G
At first equal heap sizes of 10 Gb were tested and applied to the four GATK tools SortSam, MarkDuplicates, HaplotypeCaller and CombineGVCFs. This was achieved by setting an environment variable:
export _JAVA_OPTIONS=-Xmx10G
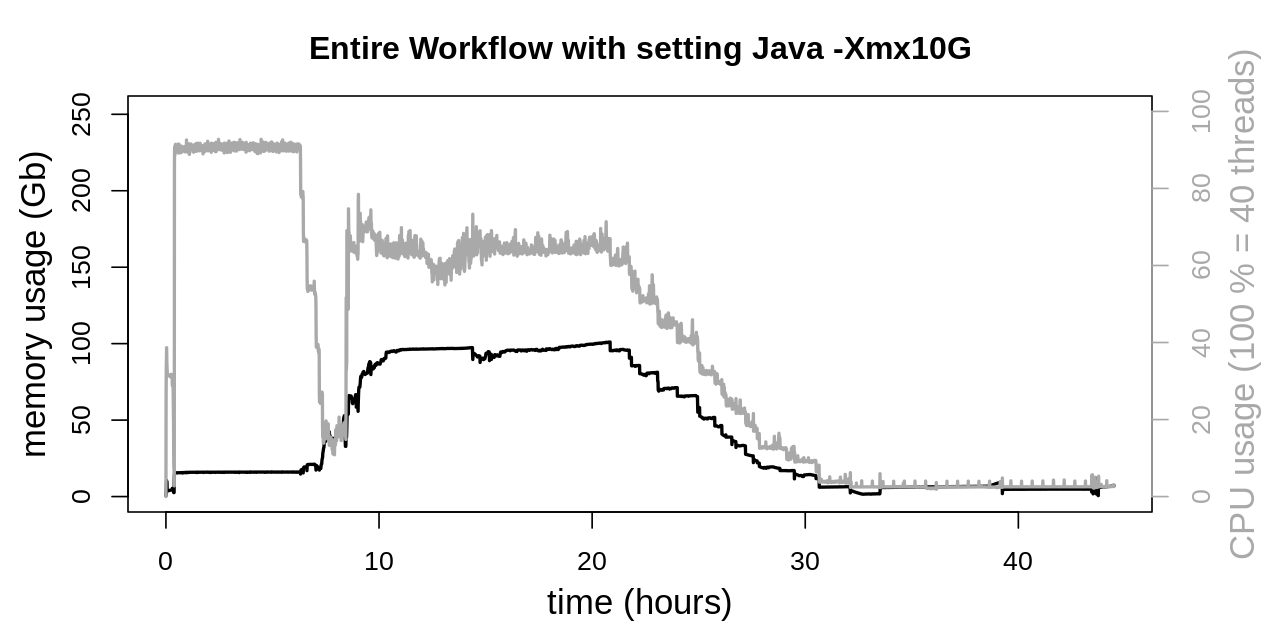
CPU usage is not significantly affected. But memory consumption in the second phase of the workflow is drastically lowered. Previously memory consumption reached a plateau at approx. 225 Gb, which could be lowered to approx. 100 Gb.
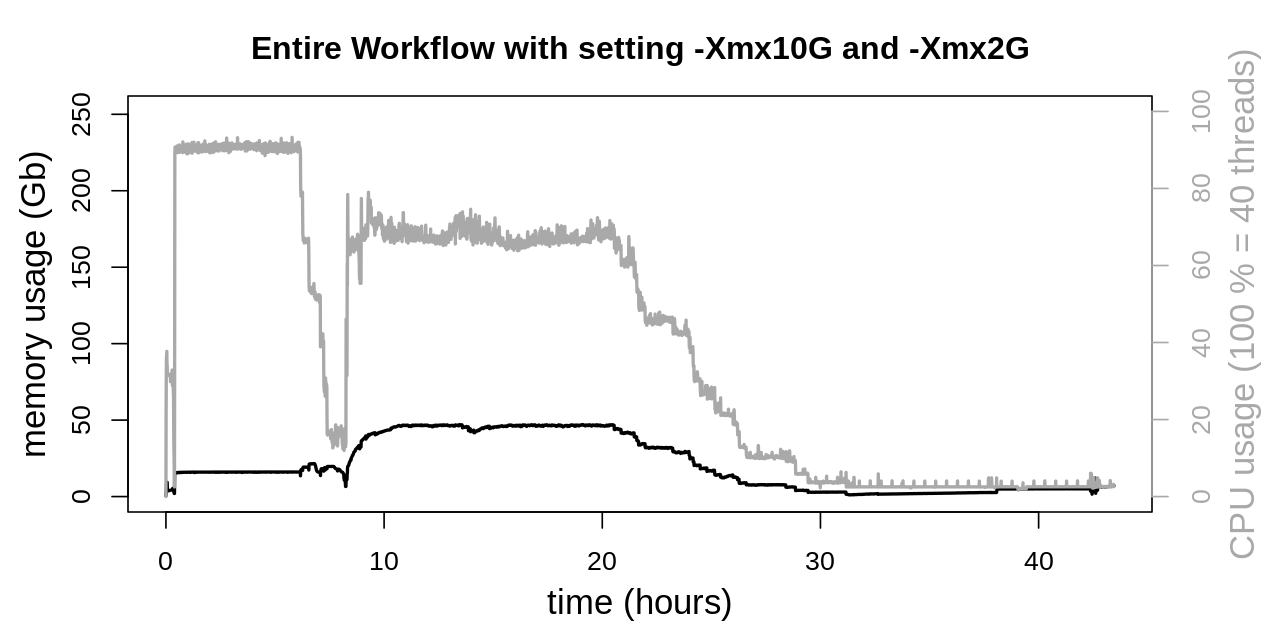
Workflow with optimized heap sizes
To further optimize memory consumption of OVarFlow, Java heap sizes were every more granularly tuned to the single GATK tools:
GATK SortSam
export _JAVA_OPTIONS=-Xmx10G
GATK MarkDuplicates, HaplotypeCaller and CombineGVCFs
export _JAVA_OPTIONS=-Xmx2G
In doing so memory consumption of the second phase could further be reduced considerably. Memory utilization doesn’t even exceed 50 Gb, which is another reduction by approx. 50 % as compared to only using -Xmx10G. Despite this drastic reduction CPU usage was not negatively affected by those changes.