Java Garbage Collection
The CPU usage of some GATK tools is heavily affected by the Java Garbage Collection (GC). The Java HotSpot VM offers three different garbage collectors. The parallel collector is the default on larger hardware (Java 8 documentation), as used in variant calling. As the name implies the parallel collector uses multithreading to accelerate garbage collection. The number of threads used, depends on the available amount of threads of the respective machine. The documentation describes:
On a machine with N hardware threads where N is greater than 8, the parallel collector uses a fixed fraction of N as the number of garbage collector threads. The fraction is approximately 5/8 for large values of N. At values of N below 8, the number used is N. On selected platforms, the fraction drops to 5/16.
This is important, as the actual number of used GC threads can have an enormous impact on the CPU time consumed by some GATK tools. The actual amount of used GC threads can be determined via the command:
java -XX:+PrintFlagsFinal | grep ParallelGCThreads
On various different machines (core count by lscpu) the following values were obtained:
CPU Cores |
GC Threads |
8 |
8 |
28 |
20 |
64 |
43 |
160 |
103 |
To determine the effect of GC on GATK, several GATK commands were executed with different GC settings (1, 2, 4, 6, 8, 12, 16 and 20 GC threads) and their consumed CPU time (wall time and user time) as well as maximum memory consumption (resident set size - RSS) was measured via GNU time (1.8, version 1.7 includes a bug resulting in four times to high values for RSS). Each measurement was repeated three times and the resulting mean values were plotted. Depending on the computation times of the respective GATK tool, different data sets were used (SRR3041116, SRR3041413 and SRR30411137). For GATK HaplotypeCaller only an interval was used. This was done to reduce waiting times. Of course for every single analysis the same input data were used. Finally only relative changes within a single command due to Java GC are of interest here, not absolute changes due to different file sizes. The provided commands specify the used data set.
Effect on GATK SortSam
The following command was used to determine the effects of Java GC on GATK SortSam:
1FILE=SRR3041137
2/usr/bin/time -o ${LOG_FILE} --append -v \
3gatk --java-options -XX:ParallelGCThreads=${GC} SortSam \
4   -I 01_mapping/${FILE}.bam \
5   -SO coordinate \
6   -O ${TMP_DIR}/${FILE}.bam \
7   --TMP_DIR ./GATK_tmp_dir/ 2> ${TMP_DIR}/02_sort_gatk_${FILE}.log
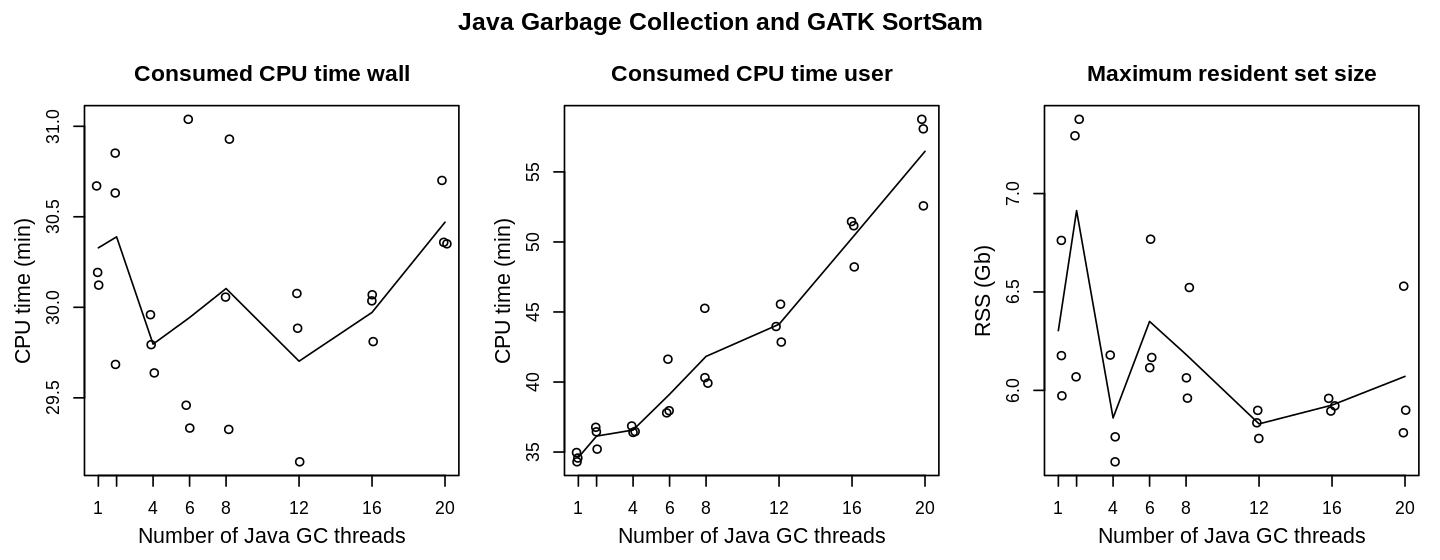
When it comes to wall time sorting of bam files is barely influenced by the number of Java GC threads. Considering the multithreaded load on several cores, as is done by the user measurement, the consumed CPU time rises approx. proportional with the number of threads. There is no obvious influence of the Java GC on memory consumption. For GATK SortSam one or two Java GC threads give the best performance.
Effect on GATK MarkDuplicates
The following command was used to determine the effects of Java GC on GATK MarkDuplicates:
1FILE=SRR3041413
2/usr/bin/time -o ${LOG_FILE} --append -v \
3gatk --java-options -XX:ParallelGCThreads=${GC} MarkDuplicates \
4   -I 02_sort_gatk/${FILE}.bam \
5   -O ${TMP_DIR}/03_mark_duplicates_${FILE}.bam \
6   -M ${TMP_DIR}/03_mark_duplicates_${FILE}.txt \
7   -MAX_FILE_HANDLES 300 \
8   --TMP_DIR ./GATK_tmp_dir/ 2> ${TMP_DIR}/03_mark_duplicates_${FILE}.log
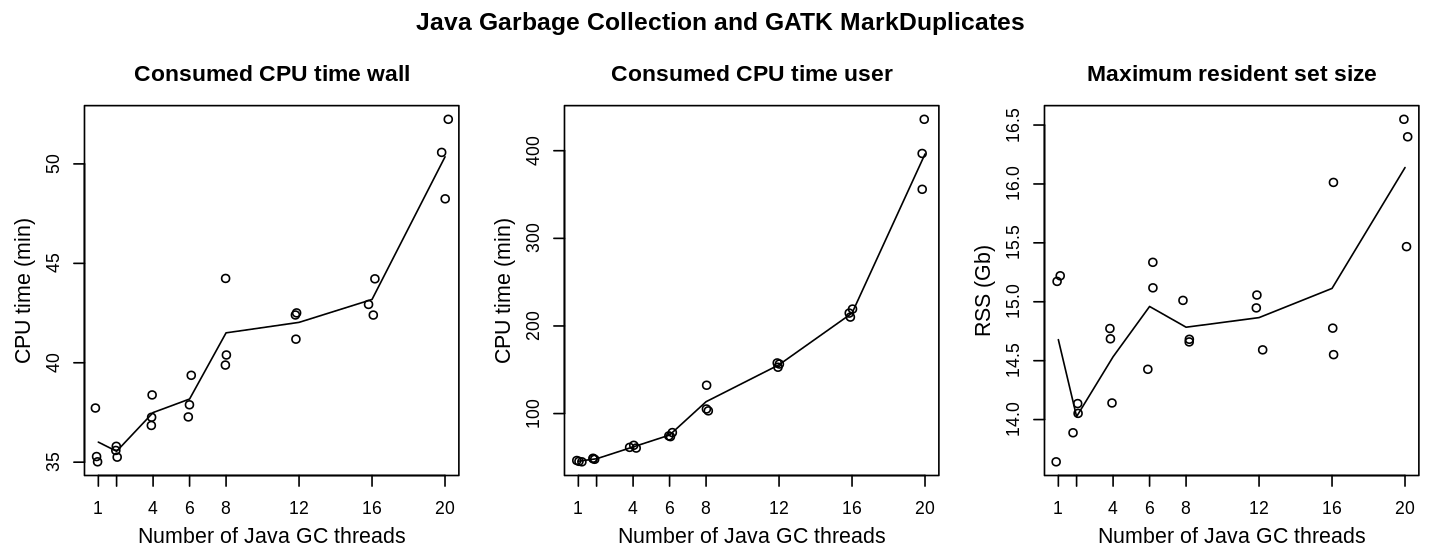
Default settings of 20 GC threads cause the highest CPU loads, both for wall and user time. This is especially important for the total consumed CPU time (user measurement), which is more than seven times higher for 20 GC threads as compared to 1 or 2 GC threads. Also memory-wise a preference for lower thread counts might be favorable. Considering all three measurements, the optimum for GATK MarkDuplicates seems to be given with two Java GC threads.
Effect on GATK HaplotypeCaller
The following command was used to determine the effects of Java GC on GATK HaplotypeCaller:
1FILE=SRR3041413
2/usr/bin/time -o ${LOG_FILE} --append -v \
3gatk --java-options -XX:ParallelGCThreads=${GC} HaplotypeCaller \
4   -ERC GVCF -I 03_mark_duplicates/${FILE}.bam \
5   -R processed_reference/GCF_000002315.6_GRCg6a_genomic.fa.gz \
6   -O ${TMP_DIR}/${FILE}_tmp.gvcf.gz \
7   -L "NC_006093.5" 2> ${TMP_DIR}/${FILE}_tmp.log
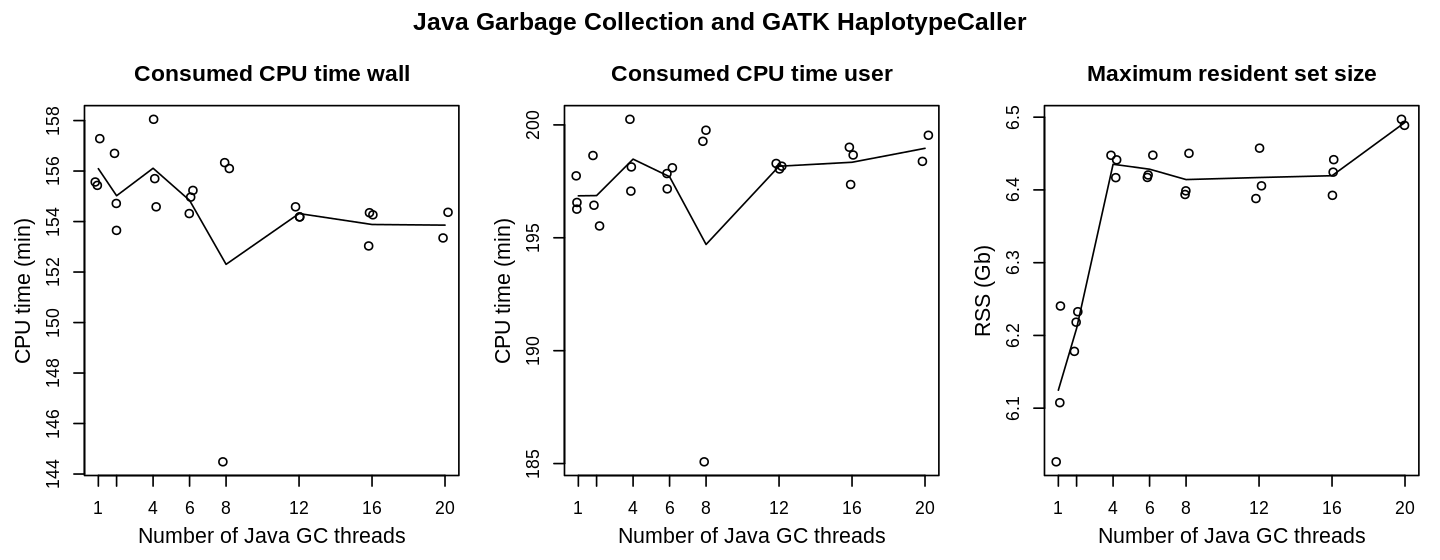
The amount of consumed CPU time is considerably less dependent on the GC settings than it has been the case for GATK SortSam and MarkDuplicates. The absolute timescale only shows statistical fluctuations. Therefore CPU load of HaplotypeCaller is barely affected by Java GC settings. From the given measurements, maximum memory usage (resident set size) appears to be favourable at one or two Java GC threads.
As the HaplotyeCaller is the application with the longest runtimes in OVarFlow, and peak CPU loads of this application were noticed at the beginning of program execution, its CPU and memory usage was investigated more closely. Over a period of 15 min CPU and RSS were measured every second using ps -p <pid> -o rss,%mem,%cpu and graphs were plotted for various Java GC settings.
1FILE=SRR3041137
2gatk --java-options -XX:ParallelGCThreads=${GC} HaplotypeCaller \
3  -ERC GVCF -I 03_mark_duplicates/${FILE}.bam \
4  -R processed_reference/GCF_000002315.6_GRCg6a_genomic.fa.gz \
5  -O ${MON_DIR}/${FILE}.gvcf.gz \
6  -L "NC_006093.5"  2> ${MON_DIR}/${FILE}.log &
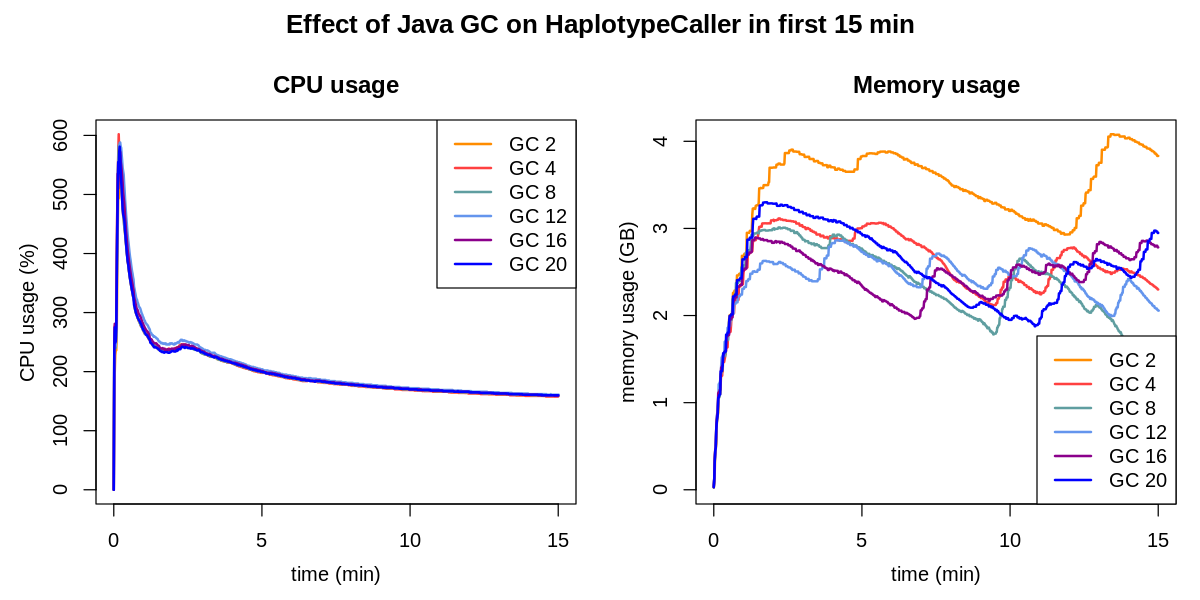
Graphs of CPU usage are congruent for all Java GC settings. The peak load at the beginning makes use of six threads (600 % CPU load) and is totally independent of Java GC thread count. Such load peaks were also observed for other GATK tools (see the section concerning file size or sequencing depth, respectively). When it comes to memory, two GC threads caused a higher usage. Still this observation only applies to the first 15 min (see previous graphics).
Effect on GATK GatherVcfs
The following command was used to determine the effects of Java GC on GATK GatherVcfs:
1FILE=SRR3041413
2/usr/bin/time -o ${LOG_FILE} --append -v \
3gatk --java-options -XX:ParallelGCThreads=${GC} GatherVcfs \
4   -O ${DIR}/05_gathered_samples_${FILE}.gvcf.gz \
5   -I 04_haplotypeCaller/${FILE}/interval_1.g.vcf.gz \
6   -I 04_haplotypeCaller/${FILE}/interval_2.g.vcf.gz \
7   -I 04_haplotypeCaller/${FILE}/interval_3.g.vcf.gz \
8   -I 04_haplotypeCaller/${FILE}/interval_4.g.vcf.gz \
9   --TMP_DIR ./GATK_tmp_dir 2> ${MON_DIR}/05_gathered_samples_${FILE}.log
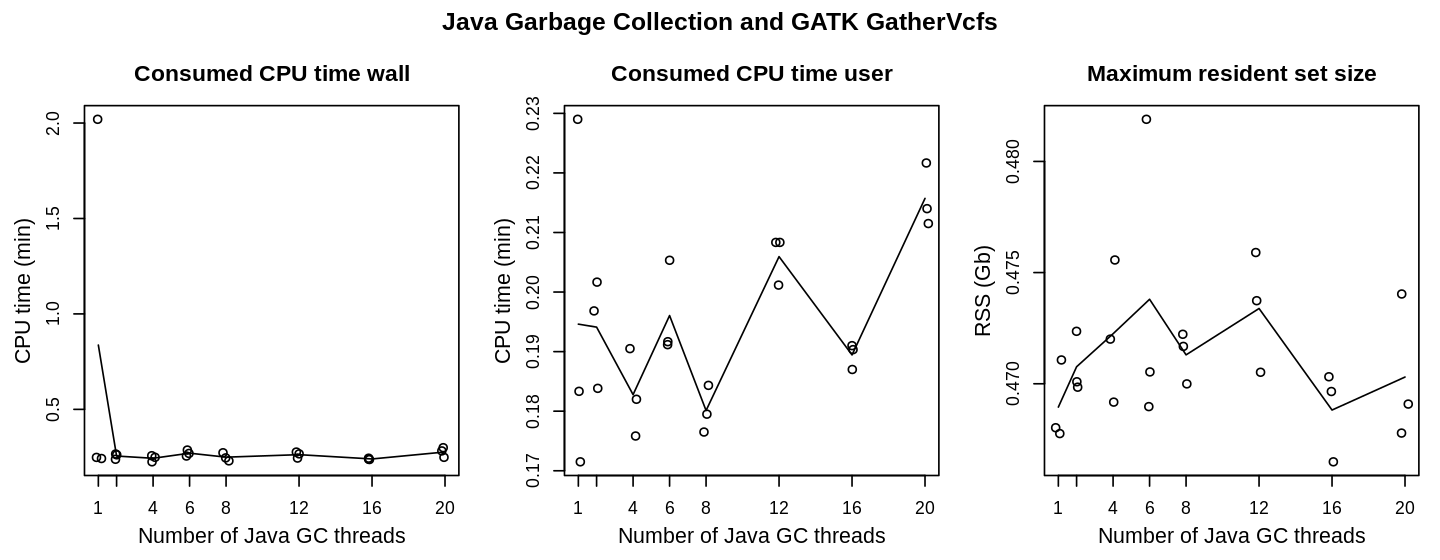
GatherVcfs is not noticeably influenced by the number Java GC threads. Only wall time of the first measurement is considerably higher (approx. 2 min). This is due to page caching of the processed data, which are kept in memory after they are fist accessed. For the first measurement data have to be obtained from permanent memory first and are thereby stored in memory for the next measurements. GatherVcfs was configured to use two Java GC threads.
Deprecated: Effect on GATK CombineGVCFs
CombineGVCFs was substituted with GatherVcfs, which is more efficient. This section is only for reference purposes.
1FILE=SRR3041413
2/usr/bin/time -o ${LOG_FILE} --append -v \
3gatk --java-options -XX:ParallelGCThreads=${GC} CombineGVCFs \
4   -O ${TMP_DIR}/${FILE}_tmp.gvcf.gz \
5   -R processed_reference/GCF_000002315.6_GRCg6a_genomic.fa.gz \
6   -V 04_haplotypeCaller/${FILE}/interval_2.gvcf.gz \
7   -V 04_haplotypeCaller/${FILE}/interval_4.gvcf.gz \
8   -V 04_haplotypeCaller/${FILE}/interval_1.gvcf.gz \
9   -V 04_haplotypeCaller/${FILE}/interval_3.gvcf.gz 2> ${TMP_DIR}/${FILE}_tmp.log
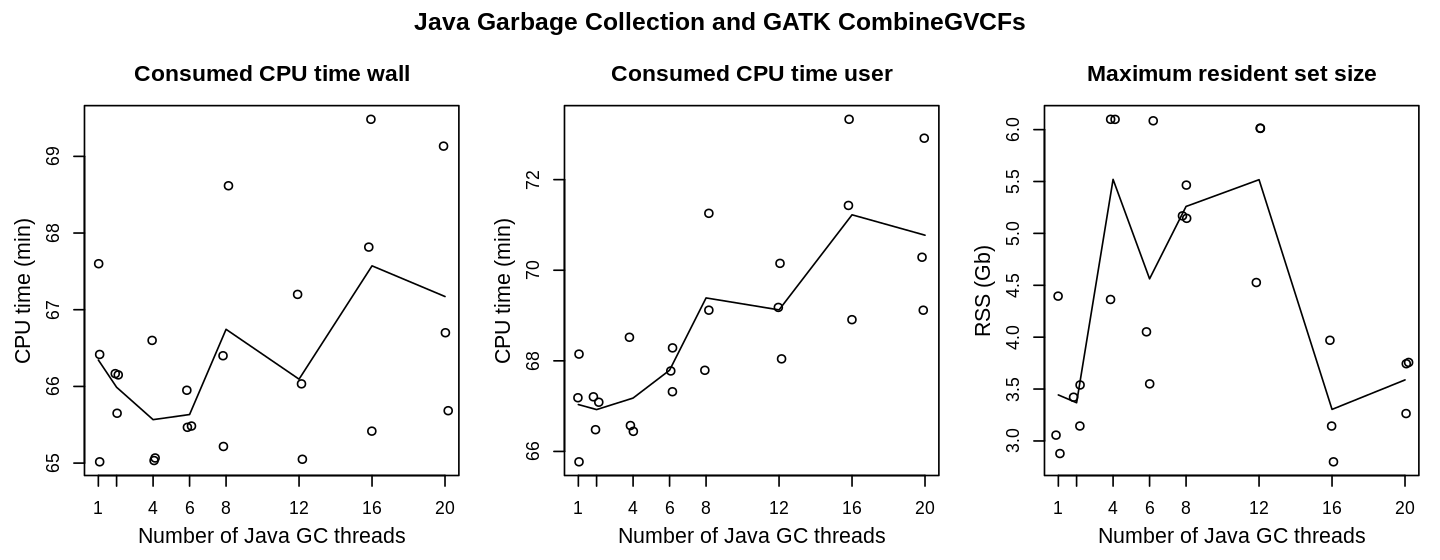
For GATK CombineGVCFs the impact of the number of Java GC threads only show a moderate effect, which is even covered by statistic variance between the measurements. Wall time is only slight light affected, were the number of negative outliers might be reduced for lower thread counts. The situation is a bit more clear for the user time, where lower thread counts are clearly favourable, but only by a few percent of the total run time. For memory usage the range is much wider (approx. 3 to 6 Gb). A constant that could be seen also in other measurements (not show) was a low and less varying memory consumption when using 2 Java GC threads. Using two Java GC threads seem to be favorable for GATK CombineGVCFs.
OVarFlow and Java GC
Interestingly not every GATK tool behaves identical. Still if there is a preference, it has always been observed in favour of low Java GC thread numbers. Some tools, like SortSam, only show a clear tendency in one of the observed parameters (in this case total CPU time). For CombineGVCFs on the other hand the tendency is not as pronounced as for SortSam or MarkDuplicates. Still there is a preference for low Java GC thread numbers.
As can be seen from the above measurements, choosing the optimal number of Java GC threads can have an enormous effect on resource usage. The obtained results were incorporated into OVarFlow, with the following settings for ParallelGCThreads:
GATK SortSam: 2
GATK MarkDuplicates: 2
GATK HaplotypeCaller: 2
GATK GatherVcfs: 2
GATK CombineGVCFs: 2
other GATK applications: 4
This is consistent with a block post in the GATK forum (date of post Oct 2017; posted during transition from GATK 3 to 4, seemingly valid for both versions):
You would be better off setting it [Java GC thread count] to 2-4 threads. Performance gets worse beyond that typically from what the developers have seen.